Pre-Open Data

Key Data for the Week
- Monday – UK – Industrial Production
- Tuesday – AUS – NAB Business Conditions & Confidence
- Tuesday – UK – ILO Unemployment Rate
- Wednesday – CHINA – Trade Balance
- Wednesday – US – Consumer Price Index
- Wednesday – EUR – Industrial Production
- Thursday – AUS – Unemployment Rate
- Thursday – CHINA – Consumer Price Index
- Friday – EUR – Trade Balance
- Friday – US – Retail Sales

Australian Market
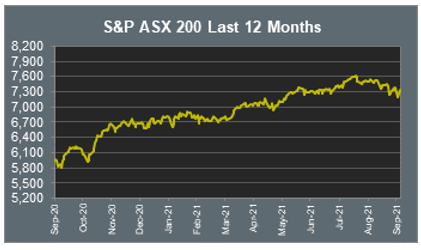
The Australian sharemarket lifted 0.9% on Friday, as all sectors closed higher. Materials was the strongest performing sector, up 1.8%, followed by Information Technology, which added 1.3%. Over the week, the local ASX 200 rose 1.9%.
The Financials sector gained 0.9% as all major banks except Westpac closed higher. NAB led the gains, up 1.4%, followed by Commonwealth Bank and ANZ, which rose 1.0% and 0.5% respectively, while Westpac slipped 0.2%. Fund managers also enjoyed gains; Magellan Financial Group lifted 5.6% and Australian Ethical Investment closed up 2.6%, while Challenger added 1.9%.
Strong gains among mining heavyweights boosted the Materials sector; Rio Tinto rallied 4.0% and BHP lifted 3.0%, while Fortescue Metals closed up 2.4%. Gold miners also outperformed; Northern Star Resources and Evolution Mining rose 1.8% and 1.6% respectively, while Newcrest Mining added 1.0%.
The Australian futures market points to a 0.05% decline today, driven by weaker overseas markets.
Overseas Markets
European sharemarkets were mixed on Friday. Oil stocks led the gains; Royal Dutch Shell added 1.0% and TotalEnergies lifted 1.5%, while BP rose 2.5%. UK travel and leisure stocks outperformed following an announcement the UK will remove COVID-19 quarantine requirements for 46 destinations; International Airlines Group lifted 2.2% and British hotel and restaurant company Whitbread added 1.4%, while Ryanair gained 0.3%. By the close of trade, the STOXX Europe 600 and German DAX both fell 0.3%, while the UK FTSE 100 gained 0.3%.
US sharemarkets were weaker on Friday. Employment data missed expectations, as nonfarm payrolls grew by 194,000 jobs last month, compared with a consensus of 500,000. The Energy sector was the strongest performer, up 3.1%; ExxonMobil improved 2.5% and Chevron added 2.2%. The Information Technology sector closed lower; Spotify gave up 0.9% and Fortinet fell 0.8%, while Apple slipped 0.3%. However, Microsoft bucked the trend to add 0.3%.
By the close of trade, the NASDAQ lost 0.5% and the S&P 500 closed down 0.2%, while the Dow Jones finished the session flat.
CNIS Perspective
Funds focusing on the environment, sustainability and good corporate governance (ESG) have seen an explosive growth over the past few years. According to Morningstar, US ESG funds now have more than US$300 billion in assets, compared to just around US$100 billion three years earlier. However, have the engagement efforts of asset managers had any effect on greenhouse gas emissions? Or are investors falling for the ‘green wash’ effect that makes you feel good about your investments by name, but in reality, are not much different from most other portfolios?
As we head to a path of net zero emissions by 2050, the corporate world has taken the lead in many countries to prove they are being considerate to ESG factors. Fund managers are also aware of the tremendous draw of being ethically minded, with the particular appeal it has to millennial and Gen Z investors. However, when you look under the hood of what investments your fund is actually holding, it might not be a true representation of the spirit of your ethical ideals. The recent outperformance of many ESG funds in 2019 and 2020 has certainly been due to their larger allocations to the lower carbon emitting big tech firms. For example, Facebook is a top 5 holding among several of the larger ESG labelled exchange traded funds. However, Facebook’s large weight in ESG funds hurts the credibility of the industry, given the company’s ethics are certainly questionable, with the list far too long to discuss here.
OECD, the organisation representing the world’s richest countries, has slammed ESG investing for being toothless at fighting climate change. In a report, OECD hit out at ESG investing for lacking “clarity” and “transparency”. The fact that there is no consensus amongst the fund management industry on what constitutes a good ESG investment really leaves it up to individual perspectives, and sadly, good marketing.
Should you wish to discuss this or any other investment related matter, please contact your Investment Services Team on (02) 4928 8500.
Disclaimer
The material contained in this publication is the nature of the general comment only, and neither purports, nor is intended to be advice on any particular matter. Persons should not act nor rely upon any information contained in or implied by this publication without seeking appropriate professional advice which relates specifically to his/her particular circumstances. Cutcher & Neale Investment Services Pty Limited expressly disclaim all and any liability to any person, whether a client of Cutcher & Neale Investment Services Pty Limited or not, who acts or fails to act as a consequence of reliance upon the whole or any part of this publication.
Cutcher & Neale Investment Services Pty Limited ABN 38 107 536 783 is a Corporate Authorised Representative of Cutcher & Neale Financial Services Pty Ltd ABN 22 160 682 879 AFSL 433814.