Pre-Open Data

Key Data for the Week
- Thursday – US – Existing Home Sales jumped 7.0% in September.
- Friday – EUR – Markit Manufacturing PMI
- Friday – UK – Retail Sales
- Friday – US – Markit Manufacturing PMI

Australian Market
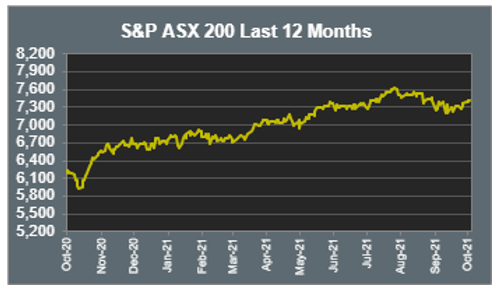
The Australian sharemarket closed relatively flat on Thursday, after gains made in the Information Technology (0.6%) and Real Estate (1.6%) sectors offset weakness from Energy (-1.4%) and Consumer Staples (-1.1%). With AGM season heating up, reported earnings have dictated much of the local market’s movement.
In the Energy sector, Woodside Petroleum (-2.3%) and Santos (-1.1%) lost ground, despite reporting respectable September performance figures. On the other hand, Australia’s largest construction group, Cimic, advanced 5.9%, despite its January to September net profit being down 36.0%. Another notable reporter was health group Healius, which rose 4.4%, after its September quarter revenue surged 44.0%, attributable to an increase in COVID-19 testing.
The Financials sector (0.3%) was mixed yesterday, as NAB (0.2%) and Westpac (0.6%) made gains, while ANZ closed down 0.5% and Commonwealth Bank (-0.1%) was relatively flat. Meanwhile, Macquarie Bank strengthened further, up 0.9%, and Australian Ethical Investment (-3.5%) lost momentum, despite reporting increased Funds Under Management (8.0%) and solid investment performance for the September quarter.
Other notable gainers from Thursday’s session included property managers, Dexus (1.9%) and Stockland (2.2%), alongside Sonic Healthcare (2.4%). The weaker performers included CSL (-1.0%), Super Retail Group (-4.4%) and Flight Centre Travel Group (-5.8%).
The Australian futures point to a flat open today.
Overseas Markets
European sharemarkets closed lower on Thursday, as the STOXX Europe 600 (-0.1%), German DAX (-0.3%) and UK FTSE 100 (-0.5%) all lost ground. The most notable weakness came from miners exposed to China, which broadly fell 3.0%, after the collapse of a US$2.6 billion asset sale by indebted Chinese property developer Evergrande. London listed Rio Tinto and BHP fell 4.8% and 3.7% respectively. Meanwhile, British major bank, Barclays, dipped 0.8% despite a strong earnings report.
US sharemarkets were somewhat mixed yesterday, as reported earnings and high inflation expectations determined market movement. The Dow Jones edged down slightly, while the S&P 500 and NASDAQ gained 0.3% and 0.6% respectively. Most sectors advanced, with Consumer Discretionary (1.4%) being the major contributor and Energy (-1.8%) the primary laggard. US Telecommunications giant, AT&T, reported positively, with increased revenue and cell phone subscribers, yet edged 0.5% lower. Meanwhile, IBM missed quarterly revenue estimates and fell 9.6%. American Airlines (1.9%) made gains, after it reported lower than expected losses, while HP rose 6.9%, after its forecast of FY2022 earnings.
CNIS Perspective
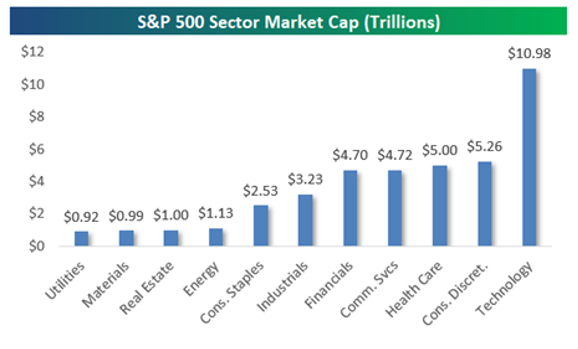
The US S&P 500 market capitalisation has increased by more than US$6 trillion this year, lifting the index's total market cap above US$40 trillion for the first time in history.
As shown below, the Technology sector makes up more than a quarter of the index, at nearly US$11 trillion. The next closest sectors hover around the US$5 trillion mark, including Consumer Discretionary, Health Care, Communication Services, and Financials. There are also four sectors that barely add up to US$4 trillion combined, being Energy, Real Estate, Materials and Utilities.
The four largest stocks in the S&P 500 are Apple, Microsoft, Alphabet (Google) and Amazon, and have a combined market capitalisation of US$8.3 trillion, more than double the size of the four smallest sectors combined!
As technology continues to evolve, playing a critical role in so many other sectors, it shows the importance of having exposure to technology in your portfolio.

Should you wish to discuss this or any other investment related matter, please contact your Investment Services Team on (02) 4928 8500.
Disclaimer
The material contained in this publication is the nature of the general comment only, and neither purports, nor is intended to be advice on any particular matter. Persons should not act nor rely upon any information contained in or implied by this publication without seeking appropriate professional advice which relates specifically to his/her particular circumstances. Cutcher & Neale Investment Services Pty Limited expressly disclaim all and any liability to any person, whether a client of Cutcher & Neale Investment Services Pty Limited or not, who acts or fails to act as a consequence of reliance upon the whole or any part of this publication.
Cutcher & Neale Investment Services Pty Limited ABN 38 107 536 783 is a Corporate Authorised Representative of Cutcher & Neale Financial Services Pty Ltd ABN 22 160 682 879 AFSL 433814.
Cutcher's Investment Lens | 7 - 11 April 2025
The failed $3 million super tax: Division 296 is done… or is it?
Cutcher's Investment Lens - Update on Trump & Tariffs | 31 March - 4 April 2025
Liberation Day - April 2025 Snapshot
Smart investing for SMEs: The basics on how to get started and grow your business.


