Pre-Open Data

Key Data for the Week
Key economic data released this week:
- Tuesday – AUS – NAB Business Conditions & Confidence – Business Conditions rose from 2 in October to 8.8 in November. Business Confidence increased from 3.2 in October to 12.4 in November.
- Wednesday – CHINA – Consumer Price Index

Australian Market
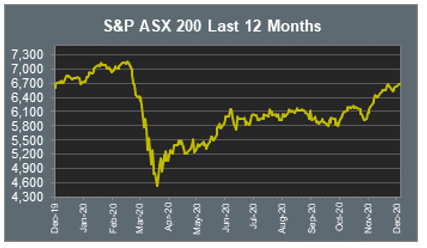
The Australian sharemarket closed up 0.2% on Tuesday in a mixed session of trade, which extended market gains for a sixth consecutive day. The Consumer Staples sector was the strongest performer, followed by Information Technology and Utilities, while the Energy sector led market losses.
The Financials sector closed higher yesterday; NAB and ANZ both added 0.3% and Commonwealth Bank gained 1.3%, however, Westpac slipped 0.6%. Bank of Queensland lost 1.0% despite reporting that only 3.0% of their housing loan portfolio had deferred payments as of 30 November. Asset Managers saw strong gains; Australian Ethical Investment jumped 4.6% and Magellan Global Fund rose 2.1%, while Challenger lifted 0.3%.
The Energy sector closed weaker yesterday, down 1.2%. Woodside Petroleum fell 0.2% after Chief Executive Peter Coleman announced his intention to leave the company after more than 10 years in the role. Santos slumped 2.0% and Beach Energy lost 1.9%, while Oil Search fell 1.6%.
The Health Care sector also saw gains on Tuesday. Sonic Healthcare added 1.6% and CSL rose 0.9%, while Cochlear and Ramsey Health Care closed up 1.0% and 0.2% respectively.
The Australian futures market points to a 0.49% rise today, driven by broadly stronger overseas markets.
Overseas Markets
European sharemarkets advanced overnight as the UK rolled out the first COVID-19 vaccine to the public and Brexit trade negotiations continued. Travel and leisure stocks were the weakest performers; easyJet tumbled 4.7% and International Airlines Group sunk 3.6%, while Trainline lost 3.0%. The Industrials sector was mixed; Eiffage and Vinci fell 1.6% and 1.1% respectively, while Veolia added 0.4%.
US sharemarkets also closed higher on Tuesday as investor sentiment was boosted by further stimulus discussions. Biotechnology and pharmaceutical companies saw strong gains due to COVID-19 vaccine developments and distribution. Pfizer climbed 3.2% and Johnson & Johnson added 1.7% after the company announced plans to target COVID-19 late-stage trials results by January 2021, while Moderna jumped 6.5% after Switzerland increased its COVID-19 vaccine doses order to 7.5 million. By the close of trade, the Dow Jones rose 0.4%, while the S&P 500 and the NASDAQ gained 0.3% and 0.5% respectively, to both close at record highs.
CNIS Perspective
A question we often get asked is, “with all the money printing from central banks in 2020, why is inflation not present?”
This can in part be summed up by the below graphs relating to US money supply and money velocity. Currently, we are seeing ‘money supply’ or quantitative easing like never before, which in turn should lower the value of each dollar. However, to date this has not been the case. Instead, we have seen low inflation continue, and in some countries, deflation is more of a concern than inflation.
This year has been a prime example of the supply of money on its own not being enough to cause inflation. The velocity of money must also be considered (the number of times one dollar is spent to buy goods and services per unit of time), since there can be no inflation unless the money is spent.
The money currently printed is not being spent or used to buy goods and services, rather being stored in bank accounts and saved, and hence no inflation has occurred.
Time will tell if money velocity picks up significantly, which has been largely in decline since 1997. Until then, inflation will be largely off the table and central banks will continue to safely print money.

Should you wish to discuss this or any other investment related matter, please contact your Investment Services Team on (02) 4928 8500.
Disclaimer
The material contained in this publication is the nature of the general comment only, and neither purports, nor is intended to be advice on any particular matter. Persons should not act nor rely upon any information contained in or implied by this publication without seeking appropriate professional advice which relates specifically to his/her particular circumstances. Cutcher & Neale Investment Services Pty Limited expressly disclaim all and any liability to any person, whether a client of Cutcher & Neale Investment Services Pty Limited or not, who acts or fails to act as a consequence of reliance upon the whole or any part of this publication.
Cutcher & Neale Investment Services Pty Limited ABN 38 107 536 783 is a Corporate Authorised Representative of Cutcher & Neale Financial Services Pty Ltd ABN 22 160 682 879 AFSL 433814.
Smart investing for SMEs: The basics on how to get started and grow your business.
ATO updates: A quick guide on what business owners need to know.
Cutcher's Investment Lens | 24 - 28 March 2025
Is your current super fund holding you back? It might be time for an SMSF.
Cutcher's Investment Lens | 17 - 21 March 2025


